
Profit calculator
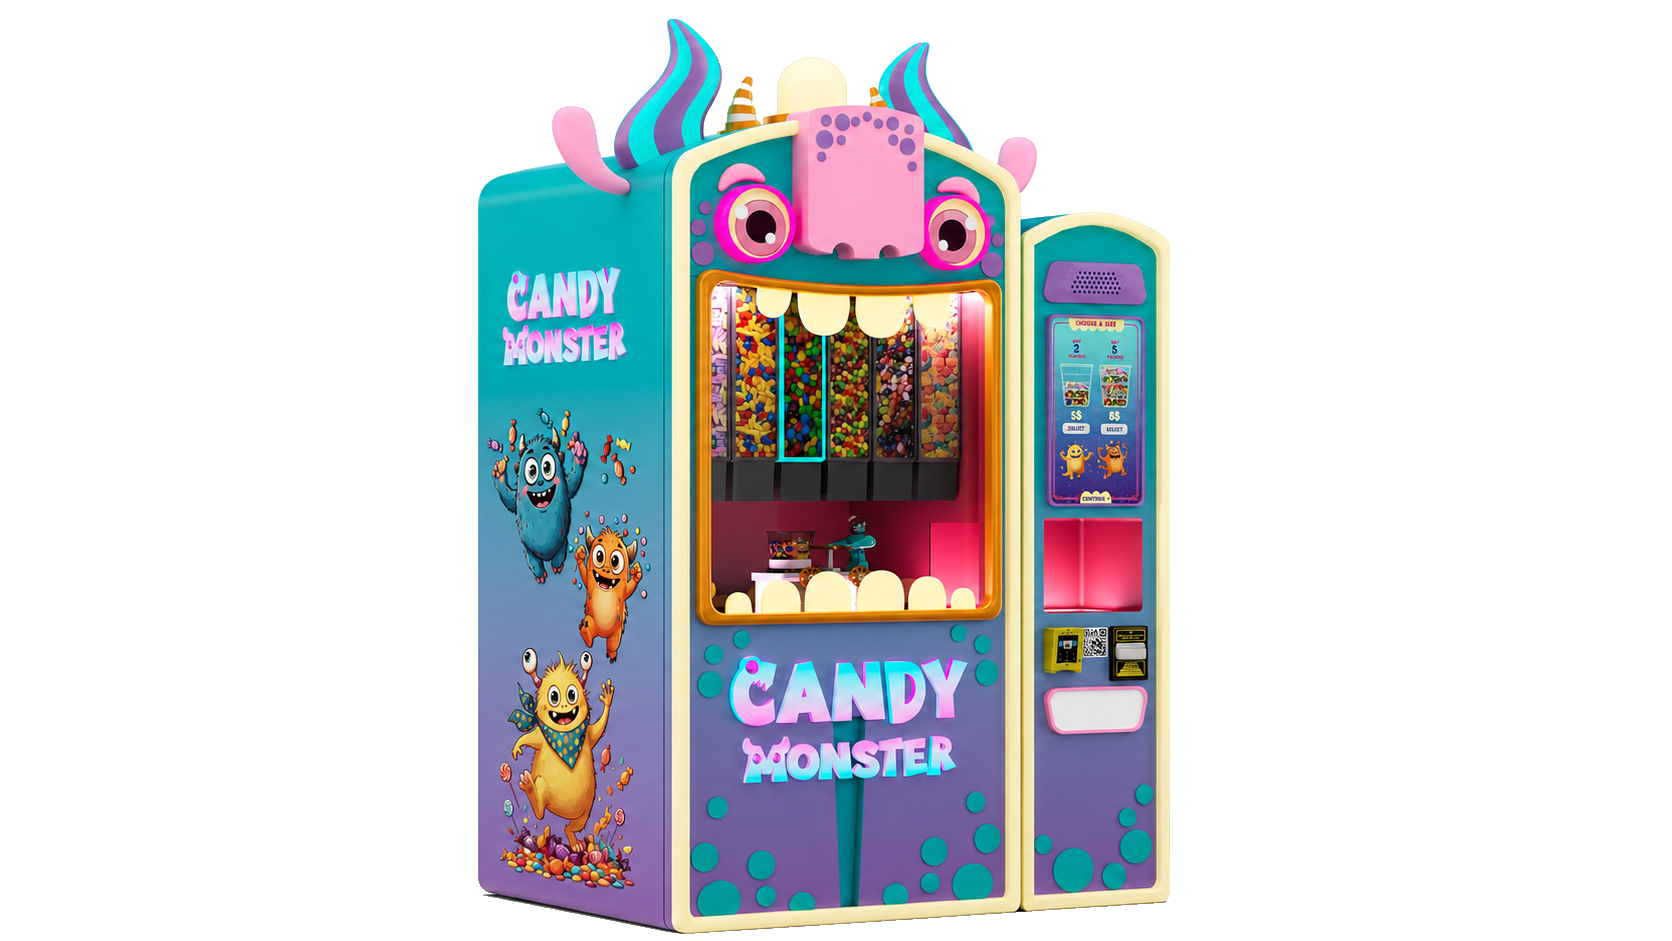
Model illustrative net profit for two units — Candy Monster and Balloon Bot — including cost of goods, site rent, payment terminal fees, public liability insurance and optional equipment finance. Every figure is an estimate you can edit.
This is not a forecast, projection or guarantee. Outputs are arithmetic on the numbers you enter. Actual results vary by site, season, product mix, pricing and operating decisions. Read the full disclaimer at the bottom of this page before relying on anything here.
Personalised candy cup. COGS covers candy, cup and lid.
Your assumptions
Operating costs
Defaults shown are indicative only: rent $800/month, terminal $20/month, public liability approximately $120/month, petrol / vehicle approximately $100/month. Your actual site agreement, merchant facility, insurance premium and travel costs will differ. Finance repayment defaults to zero — enter your own quoted repayment if applicable.
Illustrative net profit
- Revenue
- $63,875
- Less cost of goods
- − $13,688
- Gross profit
- $50,188
- Less site rent
- − $9,600
- Less payment terminal
- − $240
- Less public liability
- − $1,440
- Less petrol / vehicle
- − $1,200
- Less finance repayments
- − $0
- Net profit (before tax)
- $37,708
Gross margin per sale $5.50 (79%). Figures are before GST, income tax, depreciation, restocking labour, electricity, maintenance, card-processing percentages and any other cost not listed above.
Read this before you use these numbers.
Illustrative only. Not a guarantee of returns. Actual results vary by location, product mix and season.
It is a calculator, not a projection
This tool performs simple arithmetic on inputs that you control. It does not model your specific site, your foot traffic, your product mix or your operating capability. Nothing on this page is a forecast, projection, representation or guarantee of income by Vend Brands.
Default values are indicative only
Cost of goods, sale prices, rent, terminal fees, insurance and sales-per-day defaults are approximations supplied for illustration. Supplier pricing, landlord terms, merchant fees and insurance premiums change and vary by operator, volume, state and site. Confirm every figure independently before relying on it.
Costs excluded from this model
The model excludes, among other things: GST and income tax, machine purchase price and depreciation, delivery and installation, electricity, internet/telemetry, restocking labour and travel, consumables wastage and spoilage, card-processing percentage fees, repairs and maintenance, warranty-excluded damage, licensing fees, accounting and compliance costs, and any site-specific charges. Your real net profit will be lower than a model that ignores these costs.
No financial, tax or investment advice
Information on this page is general in nature and is not financial, accounting, tax, legal or investment advice, and does not consider your objectives, financial situation or needs. Seek advice from a licensed professional before making any purchase, finance or investment decision.
Business risk
All business ventures carry risk. A vending asset may earn materially less than any figure shown here, may earn nothing, and it is possible to lose some or all of the capital invested. Past performance of any machine or location is not a reliable indicator of future performance.
By using this calculator you acknowledge that Vend Brands accepts no liability for decisions made in reliance on its outputs. See our full earnings disclaimer and legal terms.
Want the real numbers for a real site?
Talk to us about actual supplier costs, current site terms and what a specific location is likely to support.